

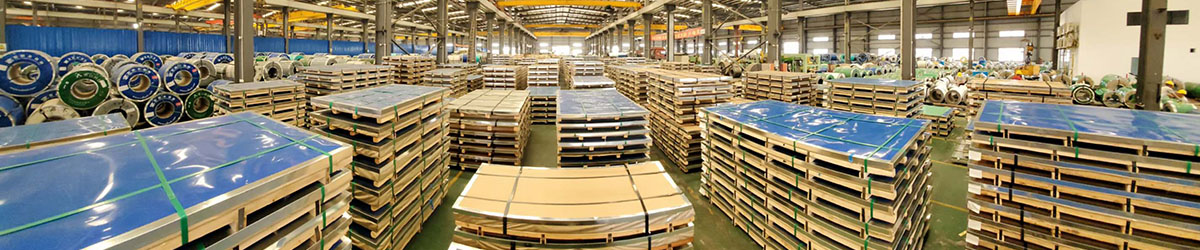
Raw materials sit at the base of every manufacturing cost structure, and in the electrical industry they sit closer to the surface than in most. Copper and brass products are used wherever current has to be carried, switched or connected, so the price of the metal moves directly into the price of the finished product. Jindalai Steel Group Co., Ltd., as a manufacturer and supplier of copper and brass products, works on both sides of that equation: the alloy has to perform, and the commercial terms have to hold through a volatile market.
This article looks at how copper price movements reach the procurement desk of an electrical manufacturer, which instruments are available to manage that exposure, and what a supplier can reasonably be asked to guarantee. The data presented here is drawn from public price series and industry studies, and the conclusions are framed for buyers rather than for traders.
1 Understanding Copper and Brass Products
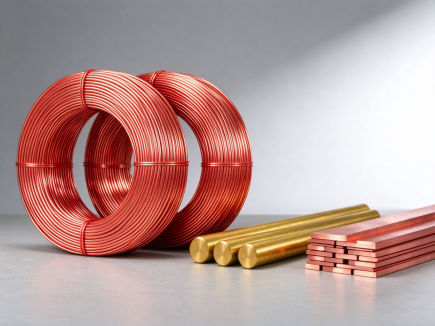
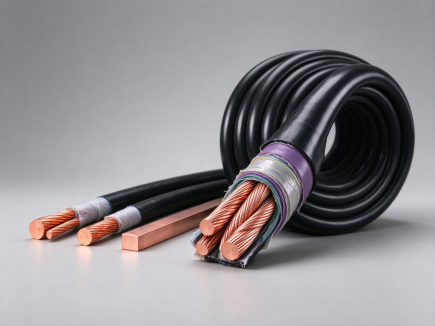
Copper is the reference conductor of the electrical industry. Its conductivity is the standard against which other metals are measured, it resists corrosion in normal atmospheres, and it can be drawn into wire, rolled into strip or extruded into busbar without difficulty. Those properties put it in cables, windings, circuit boards, busbars and connectors, which together form the conductive backbone of any electrical system.
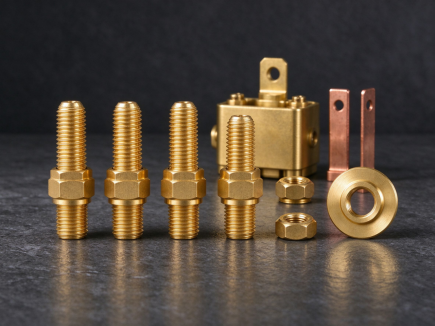
Brass is a copper-zinc alloy, and it is chosen for a different combination of properties. Adding zinc raises strength and lowers the cost per kilogram, while keeping enough conductivity for current-carrying parts that also have to be machined, threaded or formed. Brass connectors, terminals, fittings and small housings are therefore common where the part must hold a thread, resist vibration and remain dimensionally stable over time.
Table 1 compares the two materials on the criteria that usually decide which one goes into a bill of materials.
Table 1 Copper and brass compared: the properties that drive material selection
|
Criterion |
Copper (Cu) |
Brass (Cu-Zn alloy) |
|
Electrical conductivity |
Reference conductor, approximately 100% IACS | Lower, typically around a quarter to a third of copper’s conductivity |
|
Density |
Approximately 8.96 g/cm3 | Approximately 8.4 to 8.7 g/cm3, depending on zinc content |
|
Melting range |
Approximately 1,085 °C | Approximately 900 to 940 °C |
|
Corrosion behaviour |
Good in normal atmospheres; patinates outdoors | Better resistance to some waters and atmospheres; dezincification possible in certain grades |
|
Typical product forms |
Wire rod, strip, busbar, tube | Round bar, rod, hollow sections, forgings |
|
Main selection driver |
Conductivity and ductility | Machinability, strength and cost per part |
|
Price linkage |
LME copper plus fabrication premium | Copper content plus zinc and alloying additions |
2 The Role of Jindalai Steel Group Co., Ltd.
Jindalai Steel Group has established itself as a manufacturer of copper and brass products serving customers in the electrical industry. Its product range covers copper wire, bars, plates and strip as well as brass rod, bar and fittings, so a buyer can source the conductor and the machined connector from the same quality system rather than reconciling two certificates of conformity.
What matters commercially is less the breadth of the catalogue than the consistency behind it. Dimensional tolerance, alloy composition and surface condition have to repeat from lot to lot, because a buyer who has qualified a material in a design does not want to requalify it on every order. Figure 2 shows the kind of finished brass component that this consistency supports.
3 Impact of Copper Price Fluctuations
Copper is priced on a global exchange and settles against a market that reacts to mine supply, refining capacity, inventory levels, exchange rates, energy costs and expectations for demand. The result is a price series that moves continuously and, over a contract year, can move by a margin large enough to erase the profit on an order.
The five-year record in Table 2 shows the pattern clearly. The annual average fell by more than 5% in 2022 and by a further 3.8% in 2023, then recovered by 7.7% in 2024 and 10.8% in 2025. A fabricator quoting a twelve-month programme on the basis of any single year in that sequence was, on average, wrong by a double-digit percentage.
For an electrical manufacturer the transmission is direct. Cable, busbar and winding costs are dominated by metal content, so a rise in the copper price reaches the cost of goods within one production cycle. Where the selling price is fixed by tender or by an annual framework agreement, the manufacturer absorbs the difference until the contract can be reopened.
Table 2 Annual average copper price and year-on-year change, 2021 to 2025
|
Year |
Annual average (USD per tonne) |
Year-on-year change |
|
2021 |
9,317 |
base year |
|
2022 |
8,829 |
-5.2% |
|
2023 |
8,491 |
-3.8% |
|
2024 |
9,142 |
+7.7% |
|
2025 |
9,947 |
+10.8% |
The annual average understates what a buyer actually experiences. Within a single year the daily price can swing by a quarter of its level, and a purchase order placed at the wrong point in that range costs more than the annual trend would suggest. This is why procurement teams treat copper as an exposure to be managed rather than a line item to be negotiated once.
4 Procurement Strategies for Responding to Price Changes
Four instruments are used in practice, and they are not alternatives so much as a portfolio. Table 3 compares them on the dimensions that decide which one a given business can actually carry.
Table 3 Procurement instruments compared
|
Instrument |
What it fixes |
Cost certainty |
Mainly used when |
|
Long-term contract |
Volume and price (or a price formula) for a defined period |
High |
Demand is stable and the supplier can hedge the metal |
|
Supplier diversification |
Access to alternative metal and alternative terms |
Moderate |
Single-source risk or lead-time risk is material |
|
Inventory building |
Physical availability at a known cost |
Moderate, until stock is consumed |
Prices are low and storage cost is manageable |
|
Market analysis and forecasting |
Timing and scale of purchase decisions |
Low on its own; supports the others |
Purchases are large relative to the margin |
4.1 Long-Term Contracts
A long-term contract with a supplier such as Jindalai Steel Group converts an unknown future price into a known one. Because the manufacturer can plan its budget against a fixed or formula-linked figure, it can quote its own customers with confidence. The trade-off is commitment: if the market falls sharply, the contract price sits above it, and the benefit disappears unless the agreement includes a renegotiation mechanism.
4.2 Supplier Diversification
Relying on a single source concentrates both supply risk and commercial risk in one relationship. Qualifying a second supplier keeps an alternative route open and improves the buyer’s position in any price discussion. The cost is administrative: a second approval, a second audit and a second set of incoming inspections.
4.3 Inventory Management
Buying forward into stock is the simplest hedge available to a manufacturer, and it is also the one that consumes the most cash. The calculation is not only the metal price: storage, insurance, handling and the risk of obsolete stock all have to be carried against the saving. A supplier with reliable delivery can reduce the need to hold buffer stock at all, which is often the cheaper answer.
4.4 Market Analysis and Forecasting
Forecasting does not remove the exposure, but it changes the timing of decisions. A buyer who understands the direction of the market can shift the split between contracted volume and spot purchases. This is where a supplier with direct visibility of metal cost, scrap recovery and fabrication capacity is more useful than a published index alone.
Table 4 illustrates how much of the copper price actually reaches the product price. The figures are arithmetic examples rather than market data, but they explain why two manufacturers with the same copper exposure can report very different margin outcomes.
Table 4 Illustrative effect of a 10% copper price movement on unit cost
|
Copper share of product cost |
Effect of a 10% copper price rise |
Effect of a 10% copper price fall |
|
40% |
+4.0% unit cost |
-4.0% unit cost |
|
55% |
+5.5% unit cost |
-5.5% unit cost |
|
70% |
+7.0% unit cost |
-7.0% unit cost |
Note: illustrative arithmetic only. It excludes fabrication premiums, scrap recovery, currency effects and changes in volume. Unit cost impact = copper share x price change.
5 The Future of Copper and Brass in the Electrical Industry
Demand for these materials is being pushed upward by electrification rather than by construction alone. Electric vehicles, charging infrastructure, smart grids and energy-efficient equipment all use more copper per unit than the systems they replace, and the same trend increases demand for brass in connectors, terminals and fittings.
The intensity figures in Table 5 explain why the effect on metal demand is larger than the unit volumes suggest. A battery electric car carries roughly three and a half times the copper of an equivalent combustion-engined vehicle, and an electric bus several times more again. Every one of those units also requires charging hardware, which adds copper outside the vehicle itself.
Table 5 Copper intensity by vehicle platform
|
Platform |
Copper per unit (kg) |
Multiple of an ICE car |
| Internal combustion engine car |
23 |
1.0x |
| Hybrid electric car (HEV) |
40 |
1.7x |
| Plug-in hybrid car (PHEV) |
60 |
2.6x |
| Battery electric car (BEV) |
83 |
3.6x |
| Battery electric bus |
224 to 369 |
9.7x to 16.0x |
| Charging point (per unit) |
0.7 (fast charger up to 8) |
not comparable |
The procurement consequence is that the metal exposure grows faster than the sales volume. A manufacturer moving from combustion components into electrified platforms is not simply selling more of the same product at the same margin; it is carrying a larger copper position per unit, and needs contract terms that reflect it.
6 Conclusion
The relationship between copper price fluctuations and procurement strategy in the electrical industry is a structural feature of the business, not a temporary market condition. The annual averages in Table 2 move by several percent in either direction, and the intra-year range is wider still, so a procurement plan built on a single price assumption will not survive a full contract cycle.
Jindalai Steel Group Limited operates in this environment as a supplier of copper and brass products with a consistent quality system across wire, bar, plate and fittings. Its value to an electrical manufacturer lies in giving the buyer a predictable material and a predictable commercial basis, so that the volatility is managed deliberately rather than absorbed by accident. Manufacturers that combine a formal price mechanism, a qualified second source and a realistic view of inventory cost are better placed to keep both their margins and their delivery promises as the industry electrifies.
Post time: Nov-06-2026


